Process Improvement
Quality View
The only healthcare quality dashboard built directly inside your improvement workflows. Track clinical metrics against national benchmarks, spot what's falling behind, and launch a fix. All in one place.
Quality leaders see the data. They just can't act on it fast enough.
Most quality dashboards are reporting tools bolted on top of your data. They show you a chart, then you open another system, start a new project, and hope the connection holds. It rarely does.
Hours lost to manual reporting
Board decks and committee summaries rebuilt from scratch every cycle, by hand, every time.
Data scattered across systems
Clinical metrics in one tool, PI projects in another, survey results somewhere else. No single source of truth.
No connection to national benchmarks
Leaders can't easily see which metrics are below standard, or by how much, without manual comparison.
Dashboards that stop at insight
You spot a problem in your BI tool, then open a different system to do something about it, losing context every time.
Spot a gap against national benchmarks. Launch an improvement. Right here.
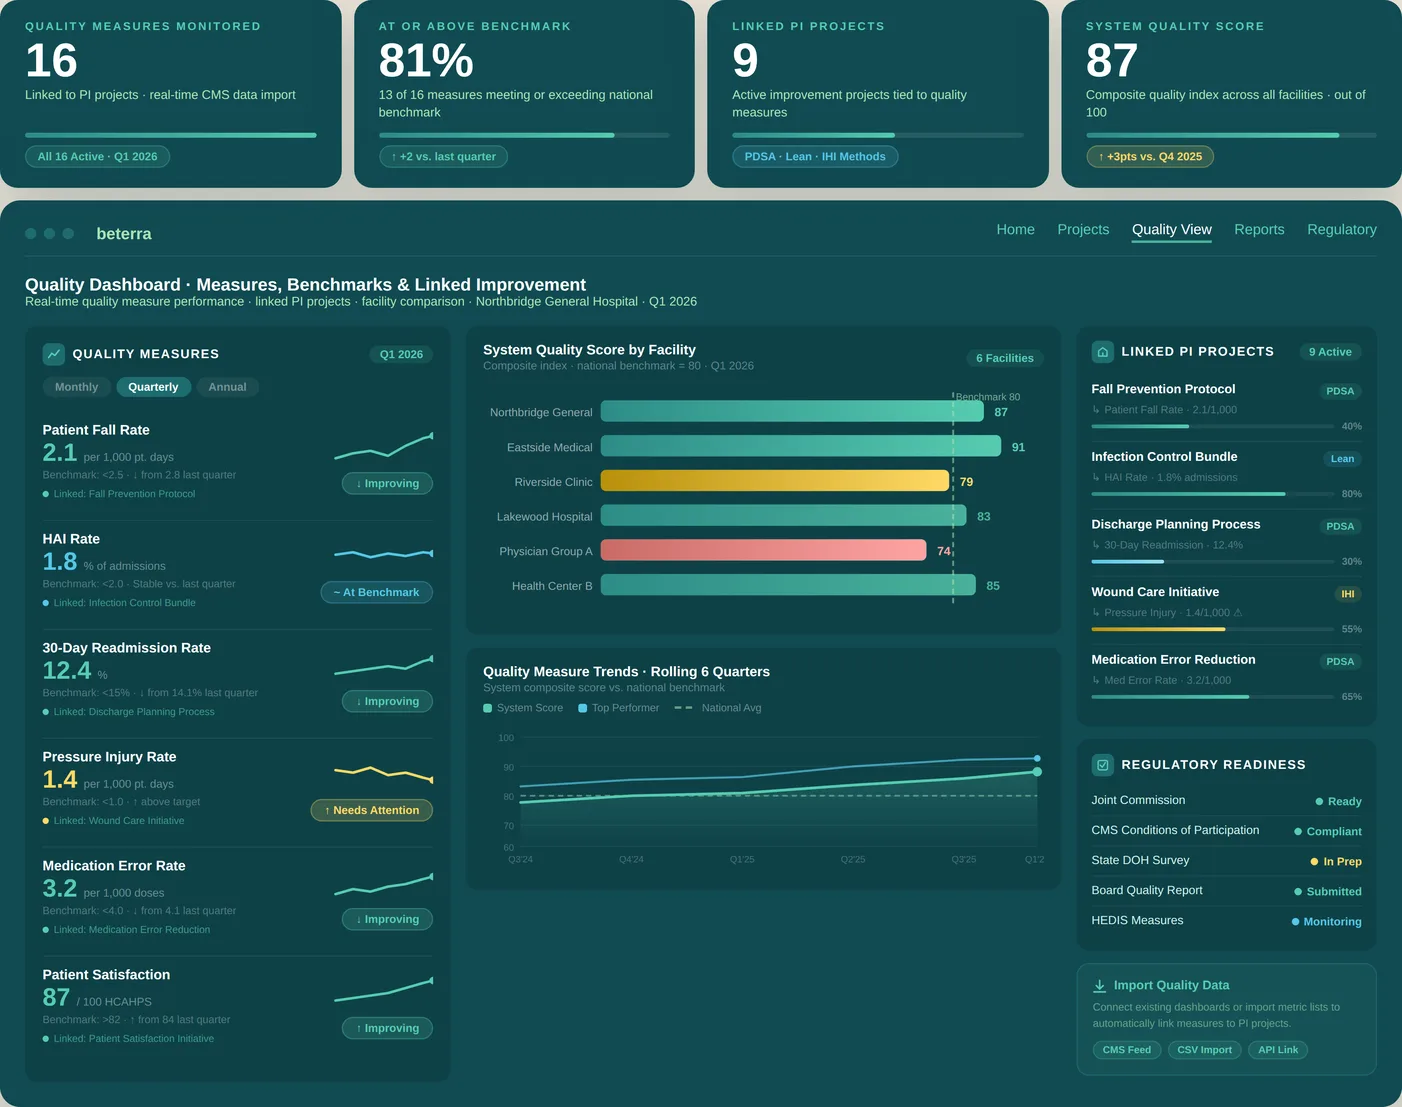
Quality View shows your clinical metrics against national benchmarks and lets leaders act on gaps without ever switching tools.
Quality Metrics Dashboard
11
Metrics below national benchmark
Review and act
3
Metrics meeting or exceeding benchmark
On track
2025
Current reporting year
vs 2024 comparison
| Metric | National Benchmark | 2024 | 2025 | Action |
|---|---|---|---|---|
| HCAHPS Overall Rating of Hospital | > 80 | 188.0 | 986.9 | Meeting benchmark |
| Inpatient Falls rate / 1000 pt days | < 3 | - | 2.0 | Meeting benchmark |
| Bar Code Medication Scanning | > 94.0% | 80.3% | 92.6% | |
| CAUTI (Catheter-Associated UTI) | < 0 | 2.0 | 134.0 | |
| Avg ER Turn Around Time Admitted (min) | < 256 | 426.0 | 2,214.0 | |
| EDTC ED Transfer Communication | > 98.0% | 97.5% | 96.2% | |
| Percentage of Patients LWBS | < 2.0% | 2.2% | 2.0% | Improved |
The moment that matters: A leader sees CAUTI rates climbing above benchmark and launches a PI project directly from the dashboard, pre-populated with the metric, the benchmark gap, and the year-over-year trend. No re-entry. No lost context.
Built different, by design.
Most dashboards are a reporting layer on top of your data. Quality View is built inside the same platform where data is collected and improvement happens.
Other dashboards
- - Data exported and manually refreshed
- - Separate tool your team has to learn
- - Shows what happened
- - Insight ends at the chart
Generic BI tools
- - Can automate reports
- - Complex setup, IT required
- - Not built for healthcare
- - No workflow connection
Quality View
- Live data from Beterra workflows
- Built into ACT, no new tool to learn
- National benchmark comparisons built in
- Launch a PI project from the dashboard
Everything a quality leader needs, automatically organized.
From benchmark gaps to board reports, everything is connected and always current.
One-click improvement launch
Flag a metric below benchmark and launch a PI project instantly, pre-filled with the data, gap, and trend already attached.
National benchmark comparisons
Every clinical metric tracked against national benchmarks, with clear gap visibility across your entire program.
Automated board reports
Committee and board summaries generate as work happens, not when someone remembers to pull the data.
Metrics drill-down
Click into any metric for unit-level detail, trend history, and year-over-year comparison, all in the same view.
Regulatory compliance view
CMS CoP and PSSM documentation organized and current. Audit readiness is the default, not a last-minute scramble.
System-wide visibility
CNOs and CQOs see quality performance across all facilities in a single consolidated view: monthly, quarterly, or yearly.
The full loop: from benchmark gap to closed improvement.
No switching tools. No re-entering data. No broken handoffs between insight and action.
Connect
Beterra pulls from your existing clinical data sources automatically. No manual exports, no refresh cycles.
Compare
Every metric checked against national benchmarks in real time. Gaps surface with clear status, no manual analysis required.
Act
A leader spots a gap and launches a PI project in one click, pre-filled with the metric, benchmark gap, and trend data.
Close
Improvement is tracked in the same platform. Quality View updates as work progresses and the audit trail writes itself.
Less time reporting. More time improving.
90%
Less Report Build Time
Board and committee packets
1-click
From Gap to PI Project
No re-entry, no lost context
100%
Always Audit-Ready
Compliance documentation current
250+
Health Systems
Trust Beterra for quality
Quality View is powered by everything Beterra knows about your organization.
Every module feeds Quality View automatically, and Quality View can trigger action back into any of them.
SafeCulture
SafeCulture and OneCulture
Survey scores surface alongside clinical metrics. Spot the culture signal before it becomes a quality outcome.
Learn more →QAPI
QAPI and PI Management
Red metrics route directly into PI workflows. One click creates a project with benchmark gap and trend data already attached.
Learn more →Leader Rounding
Leader Rounding
Rounding compliance rates appear alongside clinical metrics, connecting leadership behavior to quality outcomes.
Learn more →ACT Platform
The ACT Platform
One login, one source of truth. Quality View sits inside the same hub as every other Beterra workflow.
Learn more →See your quality metrics the way they should work.
Schedule a demo and we'll show you Quality View against your own benchmarks, and walk you through the moment a below-benchmark metric becomes an active improvement project in one click.
Schedule Your Demo